Index Trend Analysis Report
Prepared for you on Tuesday, July 8, 2025.
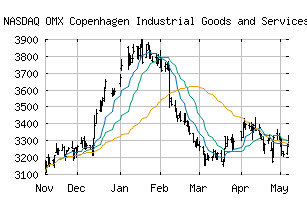
OMX Copenhagen Industrial Goods and Services GI (NASDAQ:CX5020GI)
Weak Uptrend (+65) - CX5020GI is showing signs of weakening momentum to the upside. Monitor CX5020GI as it may be in the beginning stages of a reversal.
Is it time to buy, sell, or avoid CX5020GI?
MarketClub looks at technical strength and momentum to determine if the timing is right for CX5020GI.
Learn more about the Trade Triangles and how we make technical analysis as easy as buy and sell.
|
|||||||||||||||
|
|||||||||||||||
MarketClub’s Trade Triangles for CX5020GI
![]() The long-term trend has been UP since May 12th, 2025 at 4322.11
The long-term trend has been UP since May 12th, 2025 at 4322.11
![]() The intermediate-term trend has been DOWN since Jun 20th, 2025 at 4335.90
The intermediate-term trend has been DOWN since Jun 20th, 2025 at 4335.90
![]() The short-term trend has been UP since Jul 8th, 2025 at 4403.46
The short-term trend has been UP since Jul 8th, 2025 at 4403.46
Smart Scan Analysis for CX5020GI
Based on our trend formula, CX5020GI is rated as a +65 on a scale from -100 (Strong Downtrend) to +100 (Strong Uptrend).
| Open | High | Low | Price | Change |
|---|---|---|---|---|
| 4392.03 | 4469.99 | 4392.03 | 4422.73 | +22.05 |
| Prev. Close | Volume | Bid | Ask | Time |
| 4400.68 | 0 | 2025-07-08 08:06:00 |