Index Trend Analysis Report
Prepared for you on Thursday, January 2, 2025.
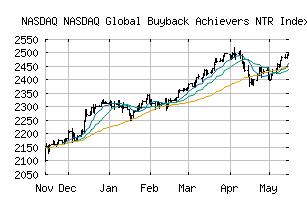
NASDAQ Global Buyback Achievers NTR Index (NASDAQ:DRBGN)
Sidelines Mode (+55) - DRBGN is moving in a sideways pattern and is unable to gain momentum in either direction. Beware of choppy movement and consider a sidelines position until a stronger trend is identified.
Is it time to buy, sell, or avoid DRBGN?
MarketClub looks at technical strength and momentum to determine if the timing is right for DRBGN.
Learn more about the Trade Triangles and how we make technical analysis as easy as buy and sell.
|
|||||||||||||||
|
|||||||||||||||
MarketClub’s Trade Triangles for DRBGN
![]() The long-term trend has been UP since Dec 1st, 2023 at 2191.47
The long-term trend has been UP since Dec 1st, 2023 at 2191.47
![]() The intermediate-term trend has been DOWN since Dec 13th, 2024 at 2700.59
The intermediate-term trend has been DOWN since Dec 13th, 2024 at 2700.59
![]() The short-term trend has been UP since Jan 2nd, 2025 at 2632.43
The short-term trend has been UP since Jan 2nd, 2025 at 2632.43
Smart Scan Analysis for DRBGN
Based on our trend formula, DRBGN is rated as a +55 on a scale from -100 (Strong Downtrend) to +100 (Strong Uptrend).
| Open | High | Low | Price | Change |
|---|---|---|---|---|
| 2620.23 | 2632.80 | 2609.99 | 2618.69 | +0.45 |
| Prev. Close | Volume | Bid | Ask | Time |
| 2620.23 | 0 | 2025-01-02 17:13:00 |