Stock Trend Analysis Report
Prepared for you on Sunday, May 11, 2025.
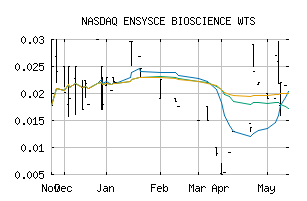
ENSYSCE BIOSCIENCE WTS (NASDAQ:ENSCW)
Countertrend Up (+85) - ENSCW is showing short-term weakness. However, look for the longer-term bullish trend to resume. As always, continue to monitor the trend score and utilize a stop order.
Is it time to buy, sell, or avoid ENSCW?
MarketClub looks at technical strength and momentum to determine if the timing is right for ENSCW.
Learn more about the Trade Triangles and how we make technical analysis as easy as buy and sell.
|
|||||||||||||||
|
|||||||||||||||
MarketClub’s Trade Triangles for ENSCW
![]() The long-term trend has been UP since Apr 23rd, 2025 at 0.0297
The long-term trend has been UP since Apr 23rd, 2025 at 0.0297
![]() The intermediate-term trend has been UP since Apr 23rd, 2025 at 0.0130
The intermediate-term trend has been UP since Apr 23rd, 2025 at 0.0130
![]() The short-term trend has been UP since Apr 10th, 2025 at 0.0090
The short-term trend has been UP since Apr 10th, 2025 at 0.0090
Smart Scan Analysis for ENSCW
Based on our trend formula, ENSCW is rated as a +80 on a scale from -100 (Strong Downtrend) to +100 (Strong Uptrend).
| Open | High | Low | Price | Change |
|---|---|---|---|---|
| 0.020 | 0.020 | 0.019 | 0.019 | -0.005 |
| Prev. Close | Volume | Bid | Ask | Time |
| 0.021 | 28998 | 2025-05-06 15:56:00 |