Mutual Trend Analysis Report
Prepared for you on Friday, December 19, 2025.
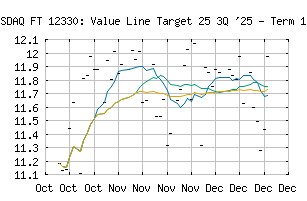
FT 12330: Value Line Target 25 3Q '25 - Term 10/9/26 (NASDAQ:FARXGX)
Crossroads (+60) - FARXGX is struggling to move into a solid trend. Beware of choppy markets and consider a sidelines position until a stronger trend is identified.
Is it time to buy, sell, or avoid FARXGX?
MarketClub looks at technical strength and momentum to determine if the timing is right for FARXGX.
Learn more about the Trade Triangles and how we make technical analysis as easy as buy and sell.
|
|||||||||||||||
|
|||||||||||||||
MarketClub’s Trade Triangles for FARXGX
![]() The long-term trend has been UP since Oct 27th, 2025 at 11.6318
The long-term trend has been UP since Oct 27th, 2025 at 11.6318
![]() The intermediate-term trend has been DOWN since Dec 17th, 2025 at 11.3116
The intermediate-term trend has been DOWN since Dec 17th, 2025 at 11.3116
![]() The short-term trend has been DOWN since Dec 12th, 2025 at 11.8063
The short-term trend has been DOWN since Dec 12th, 2025 at 11.8063
Smart Scan Analysis for FARXGX
Based on our trend formula, FARXGX is rated as a +60 on a scale from -100 (Strong Downtrend) to +100 (Strong Uptrend).
| Open | High | Low | Price | Change |
|---|---|---|---|---|
| 11.9708 | 11.9708 | 11.9708 | 11.9708 | |
| Prev. Close | Volume | Bid | Ask | Time |
| 11.9708 | 0 | 2025-12-19 00:00:00 |
| 52wk High | 12.23 | 52wk High Date | 2025-11-28 |
| 52wk Low | 9.84 | 52wk Low Date | 2025-07-22 |
| Payment Date | 2025-12-25 |