Mutual Trend Analysis Report
Prepared for you on Wednesday, November 5, 2025.
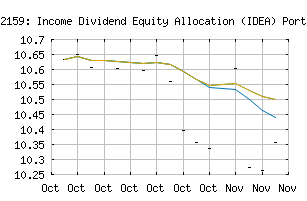
FT 12159: Income Dividend Equity Allocation (IDEA) Portfolio, Series 45 (NASDAQ:FBKTAX)
Long-Term Downtrend (-90) - FBKTAX is in a strong downtrend that is likely to continue. While FBKTAX is showing intraday strength, it remains in the confines of a bearish trend. Traders should use caution and set stops.
Is it time to buy, sell, or avoid FBKTAX?
MarketClub looks at technical strength and momentum to determine if the timing is right for FBKTAX.
Learn more about the Trade Triangles and how we make technical analysis as easy as buy and sell.
|
|||||||||||||||
|
|||||||||||||||
MarketClub’s Trade Triangles for FBKTAX
![]() The long-term trend has been DOWN since Oct 22nd, 2025 at 10.6348
The long-term trend has been DOWN since Oct 22nd, 2025 at 10.6348
![]() The intermediate-term trend has been DOWN since Oct 22nd, 2025 at 10.6348
The intermediate-term trend has been DOWN since Oct 22nd, 2025 at 10.6348
![]() The short-term trend has been DOWN since Nov 3rd, 2025 at 10.3377
The short-term trend has been DOWN since Nov 3rd, 2025 at 10.3377
Smart Scan Analysis for FBKTAX
Based on our trend formula, FBKTAX is rated as a -90 on a scale from -100 (Strong Downtrend) to +100 (Strong Uptrend).
| Open | High | Low | Price | Change |
|---|---|---|---|---|
| 10.3563 | 10.3563 | 10.3563 | 10.3563 | |
| Prev. Close | Volume | Bid | Ask | Time |
| 10.3563 | 0 | 2025-11-05 00:00:00 |
| 52wk High | 11.13 | 52wk High Date | 2025-09-11 |
| 52wk Low | 9.75 | 52wk Low Date | 2025-04-25 |
| Payment Date | 2025-10-25 |