Stock Trend Analysis Report
Prepared for you on Friday, April 26, 2024.
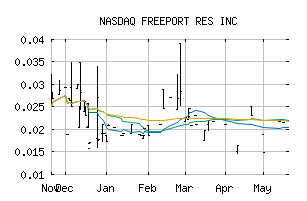
FREEPORT RES INC (NASDAQ:FEERF)
Weak Uptrend (+65) - FEERF is showing signs of weakening momentum to the upside. Monitor FEERF as it may be in the beginning stages of a reversal.
Is it time to buy, sell, or avoid FEERF?
MarketClub looks at technical strength and momentum to determine if the timing is right for FEERF.
Learn more about the Trade Triangles and how we make technical analysis as easy as buy and sell.
|
|||||||||||||||
|
|||||||||||||||
MarketClub’s Trade Triangles for FEERF
![]() The long-term trend has been UP since Feb 22nd, 2024 at 0.02000
The long-term trend has been UP since Feb 22nd, 2024 at 0.02000
![]() The intermediate-term trend has been UP since Feb 22nd, 2024 at 0.01330
The intermediate-term trend has been UP since Feb 22nd, 2024 at 0.01330
![]() The short-term trend has been DOWN since Apr 23rd, 2024 at 0.04705
The short-term trend has been DOWN since Apr 23rd, 2024 at 0.04705
Smart Scan Analysis for FEERF
Based on our trend formula, FEERF is rated as a +65 on a scale from -100 (Strong Downtrend) to +100 (Strong Uptrend).
+65
Strong Downtrend
Sideways
Strong Uptrend
| Open | High | Low | Price | Change |
|---|---|---|---|---|
| 0.04780 | 0.04780 | 0.04780 | 0.04780 | +0.00205 |
| Prev. Close | Volume | Bid | Ask | Time |
| 0.04780 | 3000 | 2024-04-25 09:57:00 |
| 52wk High | 0.06 | 52wk High Date | 2023-05-12 |
| 52wk Low | 0.0113 | 52wk Low Date | 2024-02-09 |
| Average Volume | 42,263 | Shares Outstanding | 3,366 |
| Assets | 2,855,862M | Liabilities | 48,185M |
Get a free daily analysis and signals for FREEPORT RES INC (FEERF) - Request Your Free Report.