Mutual Trend Analysis Report
Prepared for you on Saturday, March 21, 2026.
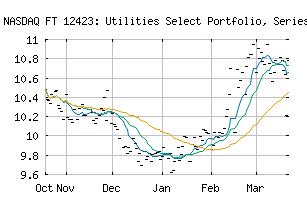
FT 12423: Utilities Select Portfolio, Series 77 (NASDAQ:FFECYX)
Countertrend Up (+85) - FFECYX is showing short-term weakness. However, look for the longer-term bullish trend to resume. As always, continue to monitor the trend score and utilize a stop order.
Is it time to buy, sell, or avoid FFECYX?
MarketClub looks at technical strength and momentum to determine if the timing is right for FFECYX.
Learn more about the Trade Triangles and how we make technical analysis as easy as buy and sell.
|
|||||||||||||||
|
|||||||||||||||
MarketClub’s Trade Triangles for FFECYX
![]() The long-term trend has been UP since Feb 13th, 2026 at 10.4723
The long-term trend has been UP since Feb 13th, 2026 at 10.4723
![]() The intermediate-term trend has been UP since Jan 14th, 2026 at 9.8752
The intermediate-term trend has been UP since Jan 14th, 2026 at 9.8752
![]() The short-term trend has been DOWN since Mar 18th, 2026 at 10.7366
The short-term trend has been DOWN since Mar 18th, 2026 at 10.7366
Smart Scan Analysis for FFECYX
Based on our trend formula, FFECYX is rated as a +85 on a scale from -100 (Strong Downtrend) to +100 (Strong Uptrend).
| Open | High | Low | Price | Change |
|---|---|---|---|---|
| 10.7804 | 10.7804 | 10.7804 | 10.7804 | |
| Prev. Close | Volume | Bid | Ask | Time |
| 10.7804 | 0 | 2026-03-21 00:00:00 |
| 52wk High | 11.16 | 52wk High Date | 2026-03-02 |
| 52wk Low | 9.62 | 52wk Low Date | 2026-01-07 |
| Payment Date | 2026-03-25 |