Mutual Trend Analysis Report
Prepared for you on Monday, March 16, 2026.
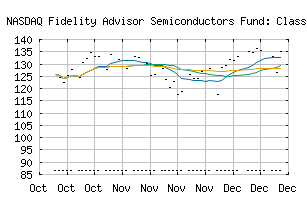
Fidelity Advisor Semiconductors Fund: Class Z (NASDAQ:FIKGX)
Bear Market Rally (-75) - FIKGX is showing some rallying power, but still remains in the confines of a long-term downtrend. Keep an eye on FIKGX as it may be in the beginning of a reversal.
Is it time to buy, sell, or avoid FIKGX?
MarketClub looks at technical strength and momentum to determine if the timing is right for FIKGX.
Learn more about the Trade Triangles and how we make technical analysis as easy as buy and sell.
|
|||||||||||||||
|
|||||||||||||||
MarketClub’s Trade Triangles for FIKGX
![]() The long-term trend has been DOWN since Aug 7th, 2024 at 78.77
The long-term trend has been DOWN since Aug 7th, 2024 at 78.77
![]() The intermediate-term trend has been DOWN since Sep 3rd, 2024 at 84.14
The intermediate-term trend has been DOWN since Sep 3rd, 2024 at 84.14
![]() The short-term trend has been UP since Sep 19th, 2024 at 86.45
The short-term trend has been UP since Sep 19th, 2024 at 86.45
Smart Scan Analysis for FIKGX
Based on our trend formula, FIKGX is rated as a -75 on a scale from -100 (Strong Downtrend) to +100 (Strong Uptrend).
| Open | High | Low | Price | Change |
|---|---|---|---|---|
| 86.44 | 86.44 | 86.44 | 130.55 | +0.01 |
| Prev. Close | Volume | Bid | Ask | Time |
| 88.97 | 0 | 86.45 | 86.45 | 2026-03-16 00:00:00 |
| 52wk High | 143.89 | 52wk High Date | 2026-02-25 |
| 52wk Low | 62.25 | 52wk Low Date | 2025-04-08 |
| Year End Close | 65.99 | Payment Date | 2019-12-23 |