Stock Trend Analysis Report
Prepared for you on Wednesday, April 24, 2024.
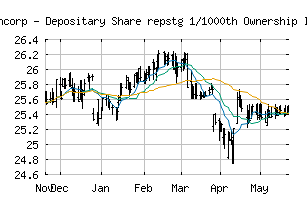
Fifth Third Bancorp - Depositary Share repstg 1/1000th Ownership Interest Perp Pfd Series I (NASDAQ:FITBI)
Weak Uptrend (+65) - FITBI is showing signs of weakening momentum to the upside. Monitor FITBI as it may be in the beginning stages of a reversal.
Is it time to buy, sell, or avoid FITBI?
MarketClub looks at technical strength and momentum to determine if the timing is right for FITBI.
Learn more about the Trade Triangles and how we make technical analysis as easy as buy and sell.
|
|||||||||||||||
|
|||||||||||||||
MarketClub’s Trade Triangles for FITBI
![]() The long-term trend has been UP since Mar 11th, 2024 at 25.90
The long-term trend has been UP since Mar 11th, 2024 at 25.90
![]() The intermediate-term trend has been DOWN since Mar 27th, 2024 at 25.53
The intermediate-term trend has been DOWN since Mar 27th, 2024 at 25.53
![]() The short-term trend has been UP since Apr 23rd, 2024 at 25.34
The short-term trend has been UP since Apr 23rd, 2024 at 25.34
Smart Scan Analysis for FITBI
Based on our trend formula, FITBI is rated as a +65 on a scale from -100 (Strong Downtrend) to +100 (Strong Uptrend).
+65
Strong Downtrend
Sideways
Strong Uptrend
| Open | High | Low | Price | Change |
|---|---|---|---|---|
| 25.39 | 25.40 | 25.26 | 25.31 | -0.07 |
| Prev. Close | Volume | Bid | Ask | Time |
| 25.38 | 33627 | 2024-04-24 15:59:00 |
| Year High | 30 | Year High Date | 2018-03-27 |
| Year Low | 26.26 | Year Low Date | 2018-11-29 |
| 52wk High | 26.25 | 52wk High Date | 2024-03-22 |
| 52wk Low | 23.4001 | 52wk Low Date | 2023-05-04 |
| Average Volume | 41,410 | Market Cap | 522M |
| Assets | 214,574,000M | Liabilities | 195,402,000M |
| Volatility | 8.72 |
Get a free daily analysis and signals for Fifth Third Bancorp - Depositary Share repstg 1/1000th Ownership Interest Perp Pfd Series I (FITBI) - Request Your Free Report.