Mutual Trend Analysis Report
Prepared for you on Monday, April 6, 2026.
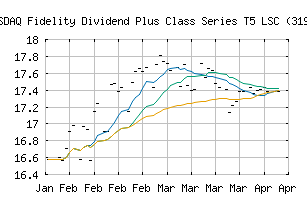
Fidelity Dividend Plus Class Series T5 LSC (319651A3) (NASDAQ:FLWDX)
Sidelines Mode (+55) - FLWDX is moving in a sideways pattern and is unable to gain momentum in either direction. Beware of choppy movement and consider a sidelines position until a stronger trend is identified.
Is it time to buy, sell, or avoid FLWDX?
MarketClub looks at technical strength and momentum to determine if the timing is right for FLWDX.
Learn more about the Trade Triangles and how we make technical analysis as easy as buy and sell.
|
|||||||||||||||
|
|||||||||||||||
MarketClub’s Trade Triangles for FLWDX
![]() The long-term trend has been UP since Feb 4th, 2026 at 16.6022
The long-term trend has been UP since Feb 4th, 2026 at 16.6022
![]() The intermediate-term trend has been DOWN since Mar 23rd, 2026 at 17.4005
The intermediate-term trend has been DOWN since Mar 23rd, 2026 at 17.4005
![]() The short-term trend has been UP since Apr 2nd, 2026 at 17.4058
The short-term trend has been UP since Apr 2nd, 2026 at 17.4058
Smart Scan Analysis for FLWDX
Based on our trend formula, FLWDX is rated as a +55 on a scale from -100 (Strong Downtrend) to +100 (Strong Uptrend).
| Open | High | Low | Price | Change |
|---|---|---|---|---|
| 17.3858 | 17.3858 | 17.3858 | 17.3858 | +0.0009 |
| Prev. Close | Volume | Bid | Ask | Time |
| 17.3858 | 0 | 2026-04-06 00:00:00 |
| Payment Date | 2026-03-31 |