Mutual Trend Analysis Report
Prepared for you on Thursday, March 12, 2026.
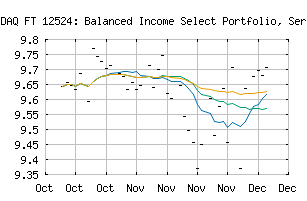
FT 12524: Balanced Income Select Portfolio, Series 152 (NASDAQ:FQRLLX)
Crossroads (+60) - FQRLLX is struggling to move into a solid trend. Beware of choppy markets and consider a sidelines position until a stronger trend is identified.
Is it time to buy, sell, or avoid FQRLLX?
MarketClub looks at technical strength and momentum to determine if the timing is right for FQRLLX.
Learn more about the Trade Triangles and how we make technical analysis as easy as buy and sell.
|
|||||||||||||||
|
|||||||||||||||
MarketClub’s Trade Triangles for FQRLLX
![]() The long-term trend has been UP since Jan 30th, 2026 at 9.7709
The long-term trend has been UP since Jan 30th, 2026 at 9.7709
![]() The intermediate-term trend has been DOWN since Mar 5th, 2026 at 9.8042
The intermediate-term trend has been DOWN since Mar 5th, 2026 at 9.8042
![]() The short-term trend has been DOWN since Mar 9th, 2026 at 9.6950
The short-term trend has been DOWN since Mar 9th, 2026 at 9.6950
Smart Scan Analysis for FQRLLX
Based on our trend formula, FQRLLX is rated as a +60 on a scale from -100 (Strong Downtrend) to +100 (Strong Uptrend).
| Open | High | Low | Price | Change |
|---|---|---|---|---|
| 9.9043 | 9.9043 | 9.9043 | 9.9043 | |
| Prev. Close | Volume | Bid | Ask | Time |
| 9.9043 | 0 | 2026-03-12 00:00:00 |
| 52wk High | 10.21 | 52wk High Date | 2026-02-13 |
| 52wk Low | 9.37 | 52wk Low Date | 2025-11-20 |
| Payment Date | 2026-03-25 |