Mutual Trend Analysis Report
Prepared for you on Sunday, April 12, 2026.
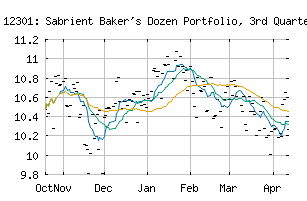
FT 12301: Sabrient Baker's Dozen Portfolio, 3rd Quarter 2025 Series (NASDAQ:FTGVAX)
Sidelines Mode (+50) - FTGVAX is failing to move into a strong trend and is encountering choppy trading conditions. Be cautious and consider taking a sidelines position until FTGVAX can gain momentum.
Is it time to buy, sell, or avoid FTGVAX?
MarketClub looks at technical strength and momentum to determine if the timing is right for FTGVAX.
Learn more about the Trade Triangles and how we make technical analysis as easy as buy and sell.
|
|||||||||||||||
|
|||||||||||||||
MarketClub’s Trade Triangles for FTGVAX
![]() The long-term trend has been DOWN since Mar 13th, 2026 at 10.2910
The long-term trend has been DOWN since Mar 13th, 2026 at 10.2910
![]() The intermediate-term trend has been UP since Apr 10th, 2026 at 10.6122
The intermediate-term trend has been UP since Apr 10th, 2026 at 10.6122
![]() The short-term trend has been UP since Apr 8th, 2026 at 10.2297
The short-term trend has been UP since Apr 8th, 2026 at 10.2297
Smart Scan Analysis for FTGVAX
Based on our trend formula, FTGVAX is rated as a +50 on a scale from -100 (Strong Downtrend) to +100 (Strong Uptrend).
| Open | High | Low | Price | Change |
|---|---|---|---|---|
| 10.2664 | 10.2664 | 10.2664 | 10.2664 | |
| Prev. Close | Volume | Bid | Ask | Time |
| 10.2664 | 0 | 2026-04-12 00:00:00 |
| 52wk High | 11.23 | 52wk High Date | 2026-01-22 |
| 52wk Low | 9.38 | 52wk Low Date | 2025-08-01 |
| Payment Date | 2026-03-25 |