Mutual Trend Analysis Report
Prepared for you on Monday, February 23, 2026.
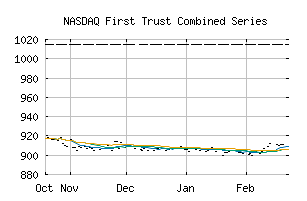
First Trust Combined Series (NASDAQ:FTHERX)
Countertrend Up (+85) - FTHERX is showing short-term weakness. However, look for the longer-term bullish trend to resume. As always, continue to monitor the trend score and utilize a stop order.
Is it time to buy, sell, or avoid FTHERX?
MarketClub looks at technical strength and momentum to determine if the timing is right for FTHERX.
Learn more about the Trade Triangles and how we make technical analysis as easy as buy and sell.
|
|||||||||||||||
|
|||||||||||||||
MarketClub’s Trade Triangles for FTHERX
![]() The long-term trend has been UP since Jul 5th, 2024 at 979.70
The long-term trend has been UP since Jul 5th, 2024 at 979.70
![]() The intermediate-term trend has been UP since Jul 3rd, 2024 at 971.79
The intermediate-term trend has been UP since Jul 3rd, 2024 at 971.79
![]() The short-term trend has been DOWN since Sep 18th, 2024 at 1017.88
The short-term trend has been DOWN since Sep 18th, 2024 at 1017.88
Smart Scan Analysis for FTHERX
Based on our trend formula, FTHERX is rated as a +85 on a scale from -100 (Strong Downtrend) to +100 (Strong Uptrend).
| Open | High | Low | Price | Change |
|---|---|---|---|---|
| 1015.08 | 1015.08 | 1015.08 | 909.15 | +0.21 |
| Prev. Close | Volume | Bid | Ask | Time |
| 1015.29 | 0 | 1015.29 | 1216.58 | 2026-02-23 00:00:00 |
| 52wk High | 1216.58 | 52wk High Date | 2026-02-20 |
| 52wk Low | 892.55 | 52wk Low Date | 2025-04-11 |
| Year End Close | 999.31 | Payment Date | 2026-02-25 |