Stock Trend Analysis Report
Prepared for you on Wednesday, April 8, 2026.
Great Elm Capital Corp. - Closed End Fund (NASDAQ:GECC)
Weak Downtrend (-65) - GECC is showing signs of a strengthening downtrend. Monitor GECC as it may be building momentum to the downside.
Is it time to buy, sell, or avoid GECC?
MarketClub looks at technical strength and momentum to determine if the timing is right for GECC.
Learn more about the Trade Triangles and how we make technical analysis as easy as buy and sell.
|
|||||||||||||||
|
|||||||||||||||
MarketClub’s Trade Triangles for GECC
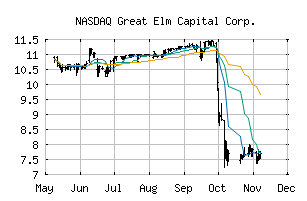
![]() The long-term trend has been DOWN since Sep 30th, 2025 at 10.26
The long-term trend has been DOWN since Sep 30th, 2025 at 10.26
![]() The intermediate-term trend has been DOWN since Feb 3rd, 2026 at 6.95
The intermediate-term trend has been DOWN since Feb 3rd, 2026 at 6.95
![]() The short-term trend has been UP since Mar 31st, 2026 at 5.10
The short-term trend has been UP since Mar 31st, 2026 at 5.10
Smart Scan Analysis for GECC
Based on our trend formula, GECC is rated as a -65 on a scale from -100 (Strong Downtrend) to +100 (Strong Uptrend).
| Open | High | Low | Price | Change |
|---|---|---|---|---|
| 5.26 | 5.34 | 5.03 | 5.14 | -0.02 |
| Prev. Close | Volume | Bid | Ask | Time |
| 5.16 | 28004 | 2026-04-08 15:59:54 |
| Year High | 10.445 | Year High Date | 2018-01-12 |
| Year Low | 7.76 | Year Low Date | 2018-10-24 |
| 52wk High | 11.455 | 52wk High Date | 2025-09-25 |
| 52wk Low | 4.63 | 52wk Low Date | 2026-03-17 |
| Average Volume | 141,391 | Shares Outstanding | 13,998 |
| Assets | 340,775,000M | Liabilities | 227,829,000M |
| Volatility | 40.9 |