Mutual Trend Analysis Report
Prepared for you on Monday, March 23, 2026.
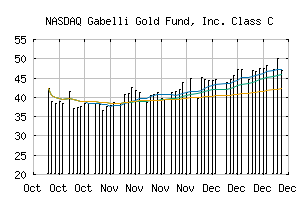
Gabelli Gold Fund, Inc. Class C (NASDAQ:GLDCX)
Countertrend Up (+85) - GLDCX is showing short-term weakness. However, look for the longer-term bullish trend to resume. As always, continue to monitor the trend score and utilize a stop order.
Is it time to buy, sell, or avoid GLDCX?
MarketClub looks at technical strength and momentum to determine if the timing is right for GLDCX.
Learn more about the Trade Triangles and how we make technical analysis as easy as buy and sell.
|
|||||||||||||||
|
|||||||||||||||
MarketClub’s Trade Triangles for GLDCX
![]() The long-term trend has been UP since Apr 1st, 2024 at 16.35
The long-term trend has been UP since Apr 1st, 2024 at 16.35
![]() The intermediate-term trend has been UP since Sep 13th, 2024 at 20.28
The intermediate-term trend has been UP since Sep 13th, 2024 at 20.28
![]() The short-term trend has been UP since Sep 20th, 2024 at 20.48
The short-term trend has been UP since Sep 20th, 2024 at 20.48
Smart Scan Analysis for GLDCX
Based on our trend formula, GLDCX is rated as a +80 on a scale from -100 (Strong Downtrend) to +100 (Strong Uptrend).
| Open | High | Low | Price | Change |
|---|---|---|---|---|
| 20.22 | 20.22 | 20.22 | 45.43 | +0.26 |
| Prev. Close | Volume | Bid | Ask | Time |
| 20.48 | 0 | 20.48 | 20.48 | 2026-03-23 00:00:00 |
| 52wk High | 56.48 | 52wk High Date | 2026-03-03 |
| 52wk Low | 21.86 | 52wk Low Date | 2025-04-04 |
| Year End Close | 16.14 | Payment Date | 2019-12-27 |