Mutual Trend Analysis Report
Prepared for you on Thursday, March 19, 2026.
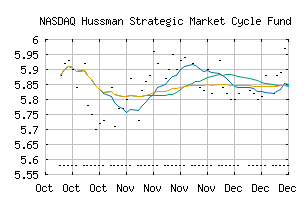
Hussman Strategic Market Cycle Fund (NASDAQ:HSGFX)
Weak Downtrend (-65) - HSGFX is showing signs of a strengthening downtrend. Monitor HSGFX as it may be building momentum to the downside.
Is it time to buy, sell, or avoid HSGFX?
MarketClub looks at technical strength and momentum to determine if the timing is right for HSGFX.
Learn more about the Trade Triangles and how we make technical analysis as easy as buy and sell.
|
|||||||||||||||
|
|||||||||||||||
MarketClub’s Trade Triangles for HSGFX
![]() The long-term trend has been DOWN since Nov 10th, 2023 at 6.35
The long-term trend has been DOWN since Nov 10th, 2023 at 6.35
![]() The intermediate-term trend has been DOWN since Aug 26th, 2024 at 5.65
The intermediate-term trend has been DOWN since Aug 26th, 2024 at 5.65
![]() The short-term trend has been DOWN since Sep 19th, 2024 at 5.60
The short-term trend has been DOWN since Sep 19th, 2024 at 5.60
Smart Scan Analysis for HSGFX
Based on our trend formula, HSGFX is rated as a -70 on a scale from -100 (Strong Downtrend) to +100 (Strong Uptrend).
| Open | High | Low | Price | Change |
|---|---|---|---|---|
| 5.58 | 5.58 | 5.58 | 5.83 | 0.00 |
| Prev. Close | Volume | Bid | Ask | Time |
| 5.58 | 0 | 5.58 | 5.58 | 2026-03-19 00:00:00 |
| 52wk High | 6.9 | 52wk High Date | 2025-04-21 |
| 52wk Low | 5.48 | 52wk Low Date | 2026-01-16 |
| Year End Close | 6.07 | Payment Date | 2026-01-02 |