Mutual Trend Analysis Report
Prepared for you on Thursday, March 19, 2026.
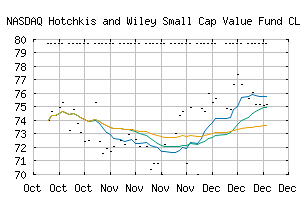
Hotchkis and Wiley Small Cap Value Fund CL A (NASDAQ:HWSAX)
Sidelines Mode (+50) - HWSAX is failing to move into a strong trend and is encountering choppy trading conditions. Be cautious and consider taking a sidelines position until HWSAX can gain momentum.
Is it time to buy, sell, or avoid HWSAX?
MarketClub looks at technical strength and momentum to determine if the timing is right for HWSAX.
Learn more about the Trade Triangles and how we make technical analysis as easy as buy and sell.
|
|||||||||||||||
|
|||||||||||||||
MarketClub’s Trade Triangles for HWSAX
![]() The long-term trend has been DOWN since Aug 7th, 2024 at 74.51
The long-term trend has been DOWN since Aug 7th, 2024 at 74.51
![]() The intermediate-term trend has been UP since Sep 19th, 2024 at 80.19
The intermediate-term trend has been UP since Sep 19th, 2024 at 80.19
![]() The short-term trend has been UP since Sep 12th, 2024 at 75.62
The short-term trend has been UP since Sep 12th, 2024 at 75.62
Smart Scan Analysis for HWSAX
Based on our trend formula, HWSAX is rated as a +50 on a scale from -100 (Strong Downtrend) to +100 (Strong Uptrend).
| Open | High | Low | Price | Change |
|---|---|---|---|---|
| 79.68 | 79.68 | 79.68 | 78.71 | 0.00 |
| Prev. Close | Volume | Bid | Ask | Time |
| 79.68 | 0 | 79.65 | 84.06 | 2026-03-19 00:00:00 |
| 52wk High | 86.44 | 52wk High Date | 2026-02-10 |
| 52wk Low | 58.35 | 52wk Low Date | 2025-04-08 |
| Year End Close | 75.83 | Payment Date | 2019-12-12 |