Index Trend Analysis Report
Prepared for you on Saturday, February 14, 2026.
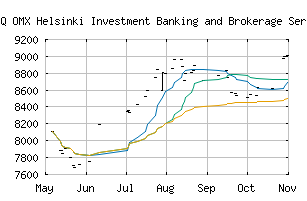
OMX Helsinki Investment Banking and Brokerage Services GI (NASDAQ:HX302020GI)
Countertrend Up (+85) - HX302020GI is showing short-term weakness. However, look for the longer-term bullish trend to resume. As always, continue to monitor the trend score and utilize a stop order.
Is it time to buy, sell, or avoid HX302020GI?
MarketClub looks at technical strength and momentum to determine if the timing is right for HX302020GI.
Learn more about the Trade Triangles and how we make technical analysis as easy as buy and sell.
|
|||||||||||||||
|
|||||||||||||||
MarketClub’s Trade Triangles for HX302020GI
![]() The long-term trend has been UP since Sep 24th, 2024 at 6550.71
The long-term trend has been UP since Sep 24th, 2024 at 6550.71
![]() The intermediate-term trend has been UP since Feb 10th, 2026 at 9917.28
The intermediate-term trend has been UP since Feb 10th, 2026 at 9917.28
![]() The short-term trend has been UP since Jan 26th, 2026 at 9673.38
The short-term trend has been UP since Jan 26th, 2026 at 9673.38
Smart Scan Analysis for HX302020GI
Based on our trend formula, HX302020GI is rated as a +80 on a scale from -100 (Strong Downtrend) to +100 (Strong Uptrend).
| Open | High | Low | Price | Change |
|---|---|---|---|---|
| 10104.25 | 10104.25 | 10104.25 | 10104.25 | +396.20 |
| Prev. Close | Volume | Bid | Ask | Time |
| 10104.25 | 0 | 2026-02-13 11:35:00 |