Index Trend Analysis Report
Prepared for you on Friday, April 19, 2024.
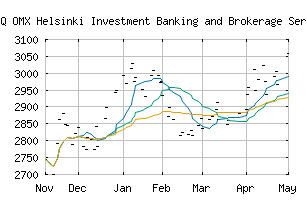
OMX Helsinki Investment Banking and Brokerage Services PI (NASDAQ:HX302020PI)
Sidelines Mode (+55) - HX302020PI is moving in a sideways pattern and is unable to gain momentum in either direction. Beware of choppy movement and consider a sidelines position until a stronger trend is identified.
Is it time to buy, sell, or avoid HX302020PI?
MarketClub looks at technical strength and momentum to determine if the timing is right for HX302020PI.
Learn more about the Trade Triangles and how we make technical analysis as easy as buy and sell.
|
|||||||||||||||
|
|||||||||||||||
MarketClub’s Trade Triangles for HX302020PI
![]() The long-term trend has been UP since Jan 3rd, 2024 at 2949.56
The long-term trend has been UP since Jan 3rd, 2024 at 2949.56
![]() The intermediate-term trend has been UP since Mar 7th, 2024 at 2865.02
The intermediate-term trend has been UP since Mar 7th, 2024 at 2865.02
![]() The short-term trend has been DOWN since Apr 17th, 2024 at 2976.99
The short-term trend has been DOWN since Apr 17th, 2024 at 2976.99
Smart Scan Analysis for HX302020PI
Based on our trend formula, HX302020PI is rated as a +55 on a scale from -100 (Strong Downtrend) to +100 (Strong Uptrend).
| Open | High | Low | Price | Change |
|---|---|---|---|---|
| 2936.05 | 2936.05 | 2936.05 | 2936.05 | -40.94 |
| Prev. Close | Volume | Bid | Ask | Time |
| 2941.55 | 0 | 2024-04-17 11:35:00 |