Index Trend Analysis Report
Prepared for you on Thursday, March 5, 2026.
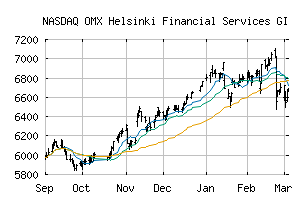
OMX Helsinki Financial Services GI (NASDAQ:HX3020GI)
Weak Downtrend (-65) - HX3020GI is showing signs of a strengthening downtrend. Monitor HX3020GI as it may be building momentum to the downside.
Is it time to buy, sell, or avoid HX3020GI?
MarketClub looks at technical strength and momentum to determine if the timing is right for HX3020GI.
Learn more about the Trade Triangles and how we make technical analysis as easy as buy and sell.
|
|||||||||||||||
|
|||||||||||||||
MarketClub’s Trade Triangles for HX3020GI
![]() The long-term trend has been UP since Sep 13th, 2024 at 4710.68
The long-term trend has been UP since Sep 13th, 2024 at 4710.68
![]() The intermediate-term trend has been DOWN since Feb 24th, 2026 at 6642.16
The intermediate-term trend has been DOWN since Feb 24th, 2026 at 6642.16
![]() The short-term trend has been DOWN since Feb 24th, 2026 at 6928.70
The short-term trend has been DOWN since Feb 24th, 2026 at 6928.70
Smart Scan Analysis for HX3020GI
Based on our trend formula, HX3020GI is rated as a -70 on a scale from -100 (Strong Downtrend) to +100 (Strong Uptrend).
| Open | High | Low | Price | Change |
|---|---|---|---|---|
| 6571.12 | 6682.26 | 6556.81 | 6664.70 | +121.94 |
| Prev. Close | Volume | Bid | Ask | Time |
| 6664.70 | 0 | 2026-03-04 11:32:00 |