Index Trend Analysis Report
Prepared for you on Monday, December 8, 2025.
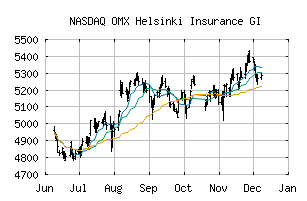
OMX Helsinki Insurance GI (NASDAQ:HX3030GI)
Weak Uptrend (+65) - HX3030GI is showing signs of weakening momentum to the upside. Monitor HX3030GI as it may be in the beginning stages of a reversal.
Is it time to buy, sell, or avoid HX3030GI?
MarketClub looks at technical strength and momentum to determine if the timing is right for HX3030GI.
Learn more about the Trade Triangles and how we make technical analysis as easy as buy and sell.
|
|||||||||||||||
|
|||||||||||||||
MarketClub’s Trade Triangles for HX3030GI
![]() The long-term trend has been UP since Feb 26th, 2025 at 4314.40
The long-term trend has been UP since Feb 26th, 2025 at 4314.40
![]() The intermediate-term trend has been UP since Nov 6th, 2025 at 5227.63
The intermediate-term trend has been UP since Nov 6th, 2025 at 5227.63
![]() The short-term trend has been DOWN since Dec 2nd, 2025 at 5361.74
The short-term trend has been DOWN since Dec 2nd, 2025 at 5361.74
Smart Scan Analysis for HX3030GI
Based on our trend formula, HX3030GI is rated as a +65 on a scale from -100 (Strong Downtrend) to +100 (Strong Uptrend).
| Open | High | Low | Price | Change |
|---|---|---|---|---|
| 5274.28 | 5297.60 | 5260.49 | 5289.12 | +21.21 |
| Prev. Close | Volume | Bid | Ask | Time |
| 5267.91 | 0 | 2025-12-08 11:34:00 |