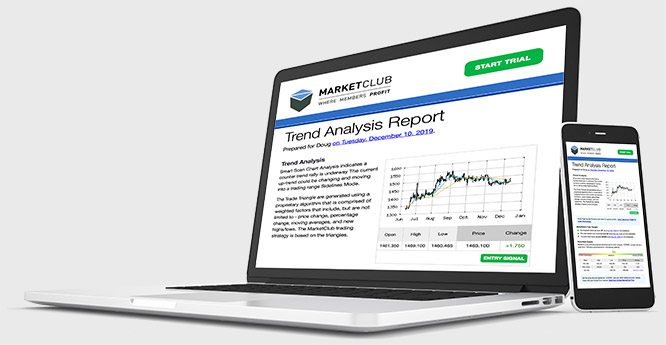
Index Trend Analysis Report
Prepared for you on Saturday, February 23, 2019.
OMX Helsinki Leisure Goods GI (NASDAQ:HX3740GI)
Smart Scan Chart Analysis confirms that a strong uptrend is in place and that the market remains positive longer term. Strong Uptrend with money management stops. A triangle indicates the presence of a very strong trend that is being driven by strong forces and insiders.
The Trade Triangles are generated using a proprietary algorithm that is comprised of weighted factors that include, but are not limited to - price change, percentage change, moving averages, and new highs/lows. The MarketClub trading strategy is based on the triangles, learn more here.
![]() |
|||||||||||||||
|
MarketClub’s Trade Triangles for HX3740GI
The long term trend has been UP since Jun 1st, 2018 at 2198.63
The intermediate term trend has been UP since Dec 4th, 2018 at 2642.57
The short term trend has been UP since Feb 15th, 2019 at 2959.50
Smart Scan Analysis for HX3740GI
Based on a pre-defined weighted trend formula for chart analysis, HX3740GI scored +100 on a scale from -100 (strong downtrend) to +100 (strong uptrend).

Open | High | Low | Price | Change |
---|---|---|---|---|
2983.3 | 2983.3 | 2983.3 | 2983.3 | +0.1 |
Prev. Close | Volume | Bid | Ask | Time |
2961.2 | 0 | 2019-02-22 11:36:00 |
52wk High | 2683 | 52wk High Date | 2018-09-20 |
52wk Low | 1887.71 | 52wk Low Date | 2018-03-05 |