Stock Trend Analysis Report
Prepared for you on Thursday, December 26, 2024.
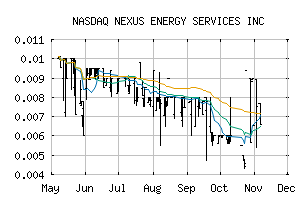
NEXUS ENERGY SERVICES INC (NASDAQ:IBGR)
Weak Uptrend (+65) - IBGR is showing signs of weakening momentum to the upside. Monitor IBGR as it may be in the beginning stages of a reversal.
Is it time to buy, sell, or avoid IBGR?
MarketClub looks at technical strength and momentum to determine if the timing is right for IBGR.
Learn more about the Trade Triangles and how we make technical analysis as easy as buy and sell.
|
|||||||||||||||
|
|||||||||||||||
MarketClub’s Trade Triangles for IBGR
![]() The long-term trend has been UP since Sep 12th, 2024 at 0.00790
The long-term trend has been UP since Sep 12th, 2024 at 0.00790
![]() The intermediate-term trend has been UP since Oct 23rd, 2024 at 0.00950
The intermediate-term trend has been UP since Oct 23rd, 2024 at 0.00950
![]() The short-term trend has been DOWN since Dec 13th, 2024 at 0.00425
The short-term trend has been DOWN since Dec 13th, 2024 at 0.00425
Smart Scan Analysis for IBGR
Based on our trend formula, IBGR is rated as a +65 on a scale from -100 (Strong Downtrend) to +100 (Strong Uptrend).
| Open | High | Low | Price | Change |
|---|---|---|---|---|
| 0.0050 | 0.0050 | 0.0050 | 0.0050 | -0.0002 |
| Prev. Close | Volume | Bid | Ask | Time |
| 0.0052 | 100500 | 2024-12-26 12:49:14 |
| Year High | 0.0099 | Year High Date | 2018-10-08 |
| Year Low | 0.0004 | Year Low Date | 2018-01-08 |
| 52wk High | 0.0179 | 52wk High Date | 2024-04-10 |
| 52wk Low | 0.003 | 52wk Low Date | 2024-07-10 |
| Average Volume | 594,355 | Shares Outstanding | 171,545 |
| Assets | 214,201M | Liabilities | 547,217M |
| Volatility | 305.7 |