Stock Trend Analysis Report
Prepared for you on Tuesday, July 1, 2025.
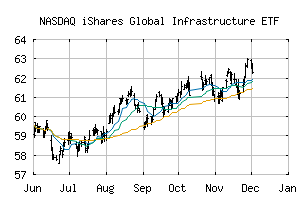
iShares Global Infrastructure ETF (NASDAQ:IGF)
Weak Uptrend (+65) - IGF is showing signs of weakening momentum to the upside. Monitor IGF as it may be in the beginning stages of a reversal.
Is it time to buy, sell, or avoid IGF?
MarketClub looks at technical strength and momentum to determine if the timing is right for IGF.
Learn more about the Trade Triangles and how we make technical analysis as easy as buy and sell.
|
|||||||||||||||
|
|||||||||||||||
MarketClub’s Trade Triangles for IGF
![]() The long-term trend has been UP since Apr 23rd, 2025 at 55.892
The long-term trend has been UP since Apr 23rd, 2025 at 55.892
![]() The intermediate-term trend has been DOWN since Jun 16th, 2025 at 58.316
The intermediate-term trend has been DOWN since Jun 16th, 2025 at 58.316
![]() The short-term trend has been UP since Jun 24th, 2025 at 58.046
The short-term trend has been UP since Jun 24th, 2025 at 58.046
Smart Scan Analysis for IGF
Based on our trend formula, IGF is rated as a +65 on a scale from -100 (Strong Downtrend) to +100 (Strong Uptrend).
| Open | High | Low | Price | Change |
|---|---|---|---|---|
| 59.200 | 59.233 | 58.820 | 58.903 | -0.257 |
| Prev. Close | Volume | Bid | Ask | Time |
| 59.200 | 0 | 2025-07-01 10:41:48 |
| Year High | 46.8 | Year High Date | 2018-01-24 |
| Year Low | 40.04 | Year Low Date | 2018-10-29 |
| 52wk High | 59.83 | 52wk High Date | 2025-06-12 |
| 52wk Low | 47.85 | 52wk Low Date | 2024-07-02 |
| Average Volume | 1,222,844 | Shares Outstanding | 98,700 |
| Market Cap | 3,244M | Volatility | 12.21 |