Stock Trend Analysis Report
Prepared for you on Friday, October 31, 2025.
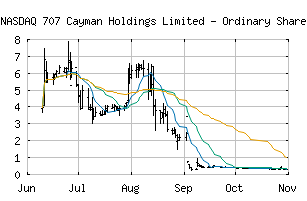
707 Cayman Holdings Limited - Ordinary Shares (NASDAQ:JEM)
Sidelines Mode (+50) - JEM is failing to move into a strong trend and is encountering choppy trading conditions. Be cautious and consider taking a sidelines position until JEM can gain momentum.
Is it time to buy, sell, or avoid JEM?
MarketClub looks at technical strength and momentum to determine if the timing is right for JEM.
Learn more about the Trade Triangles and how we make technical analysis as easy as buy and sell.
|
|||||||||||||||
|
|||||||||||||||
MarketClub’s Trade Triangles for JEM
![]() The long-term trend has been DOWN since Jul 9th, 2025 at 3.700100
The long-term trend has been DOWN since Jul 9th, 2025 at 3.700100
![]() The intermediate-term trend has been UP since Oct 28th, 2025 at 0.443700
The intermediate-term trend has been UP since Oct 28th, 2025 at 0.443700
![]() The short-term trend has been UP since Oct 28th, 2025 at 0.325499
The short-term trend has been UP since Oct 28th, 2025 at 0.325499
Smart Scan Analysis for JEM
Based on our trend formula, JEM is rated as a +50 on a scale from -100 (Strong Downtrend) to +100 (Strong Uptrend).
| Open | High | Low | Price | Change |
|---|---|---|---|---|
| 0.3210 | 0.3227 | 0.3150 | 0.3200 | -0.0005 |
| Prev. Close | Volume | Bid | Ask | Time |
| 0.3205 | 225913 | 2025-10-31 15:40:01 |
| 52wk High | 7.9 | 52wk High Date | 2025-06-25 |
| 52wk Low | 0.258 | 52wk Low Date | 2025-09-05 |
| Average Volume | 4,256,213 |