Stock Trend Analysis Report
Prepared for you on Monday, May 12, 2025.
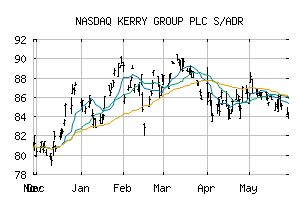
KERRY GROUP PLC S/ADR (NASDAQ:KRYAY)
Weak Uptrend (+65) - KRYAY is showing signs of weakening momentum to the upside. Monitor KRYAY as it may be in the beginning stages of a reversal.
Is it time to buy, sell, or avoid KRYAY?
MarketClub looks at technical strength and momentum to determine if the timing is right for KRYAY.
Learn more about the Trade Triangles and how we make technical analysis as easy as buy and sell.
|
|||||||||||||||
|
|||||||||||||||
MarketClub’s Trade Triangles for KRYAY
![]() The long-term trend has been UP since Jan 28th, 2025 at 104.3000
The long-term trend has been UP since Jan 28th, 2025 at 104.3000
![]() The intermediate-term trend has been UP since Apr 21st, 2025 at 110.0500
The intermediate-term trend has been UP since Apr 21st, 2025 at 110.0500
![]() The short-term trend has been DOWN since May 12th, 2025 at 107.4892
The short-term trend has been DOWN since May 12th, 2025 at 107.4892
Smart Scan Analysis for KRYAY
Based on our trend formula, KRYAY is rated as a +65 on a scale from -100 (Strong Downtrend) to +100 (Strong Uptrend).
| Open | High | Low | Price | Change |
|---|---|---|---|---|
| 104.690 | 109.350 | 104.410 | 105.607 | -3.393 |
| Prev. Close | Volume | Bid | Ask | Time |
| 109.000 | 46769 | 2025-05-12 14:33:00 |
| Year High | 117 | Year High Date | 2018-09-04 |
| Year Low | 96.54 | Year Low Date | 2018-03-22 |
| 52wk High | 112.86 | 52wk High Date | 2025-05-05 |
| 52wk Low | 79.21 | 52wk Low Date | 2024-06-20 |
| Year End Close | 54.19 | Average Volume | 5,622 |
| Shares Outstanding | 175,626 | % Institutional | 0.1 |
| Assets | 125,125,000M | Liabilities | 602,670,000M |
| Beta | 0.72 | Volatility | 39.53 |