Index Trend Analysis Report
Prepared for you on Saturday, August 2, 2025.
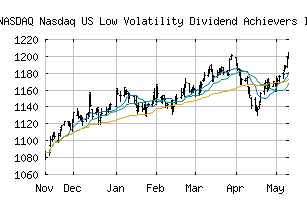
Nasdaq US Low Volatility Dividend Achievers Index (NASDAQ:LVDA)
Long-Term Downtrend (-90) - LVDA is in a strong downtrend that is likely to continue. While LVDA is showing intraday strength, it remains in the confines of a bearish trend. Traders should use caution and set stops.
Is it time to buy, sell, or avoid LVDA?
MarketClub looks at technical strength and momentum to determine if the timing is right for LVDA.
Learn more about the Trade Triangles and how we make technical analysis as easy as buy and sell.
|
|||||||||||||||
|
|||||||||||||||
MarketClub’s Trade Triangles for LVDA
![]() The long-term trend has been DOWN since Apr 9th, 2025 at 1177.96
The long-term trend has been DOWN since Apr 9th, 2025 at 1177.96
![]() The intermediate-term trend has been DOWN since Jul 31st, 2025 at 1252.13
The intermediate-term trend has been DOWN since Jul 31st, 2025 at 1252.13
![]() The short-term trend has been DOWN since Jul 28th, 2025 at 1276.30
The short-term trend has been DOWN since Jul 28th, 2025 at 1276.30
Smart Scan Analysis for LVDA
Based on our trend formula, LVDA is rated as a -90 on a scale from -100 (Strong Downtrend) to +100 (Strong Uptrend).
| Open | High | Low | Price | Change |
|---|---|---|---|---|
| 1257.20 | 1258.17 | 1247.74 | 1254.04 | +2.37 |
| Prev. Close | Volume | Bid | Ask | Time |
| 1254.04 | 0 | 2025-08-01 17:15:19 |