Index Trend Analysis Report
Prepared for you on Tuesday, March 17, 2026.
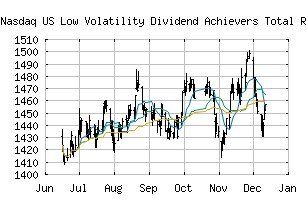
Nasdaq US Low Volatility Dividend Achievers Total Return Index (NASDAQ:LVDAT)
Sidelines Mode (+55) - LVDAT is moving in a sideways pattern and is unable to gain momentum in either direction. Beware of choppy movement and consider a sidelines position until a stronger trend is identified.
Is it time to buy, sell, or avoid LVDAT?
MarketClub looks at technical strength and momentum to determine if the timing is right for LVDAT.
Learn more about the Trade Triangles and how we make technical analysis as easy as buy and sell.
|
|||||||||||||||
|
|||||||||||||||
MarketClub’s Trade Triangles for LVDAT
![]() The long-term trend has been UP since Nov 21st, 2025 at 1485.44
The long-term trend has been UP since Nov 21st, 2025 at 1485.44
![]() The intermediate-term trend has been UP since Jan 8th, 2026 at 1474.49
The intermediate-term trend has been UP since Jan 8th, 2026 at 1474.49
![]() The short-term trend has been DOWN since Mar 3rd, 2026 at 1594.10
The short-term trend has been DOWN since Mar 3rd, 2026 at 1594.10
Smart Scan Analysis for LVDAT
Based on our trend formula, LVDAT is rated as a +55 on a scale from -100 (Strong Downtrend) to +100 (Strong Uptrend).
| Open | High | Low | Price | Change |
|---|---|---|---|---|
| 1570.24 | 1577.47 | 1558.18 | 1575.09 | -4.05 |
| Prev. Close | Volume | Bid | Ask | Time |
| 1579.14 | 0 | 2026-03-06 17:14:00 |