Index Trend Analysis Report
Prepared for you on Thursday, April 25, 2024.
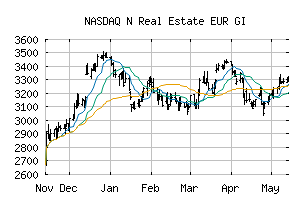
N Real Estate EUR GI (NASDAQ:N35EURGI)
Weak Downtrend (-65) - N35EURGI is showing signs of a strengthening downtrend. Monitor N35EURGI as it may be building momentum to the downside.
Is it time to buy, sell, or avoid N35EURGI?
MarketClub looks at technical strength and momentum to determine if the timing is right for N35EURGI.
Learn more about the Trade Triangles and how we make technical analysis as easy as buy and sell.
|
|||||||||||||||
|
|||||||||||||||
MarketClub’s Trade Triangles for N35EURGI
![]() The long-term trend has been UP since Nov 14th, 2023 at 2804.19
The long-term trend has been UP since Nov 14th, 2023 at 2804.19
![]() The intermediate-term trend has been DOWN since Apr 10th, 2024 at 3192.57
The intermediate-term trend has been DOWN since Apr 10th, 2024 at 3192.57
![]() The short-term trend has been DOWN since Apr 25th, 2024 at 3120.74
The short-term trend has been DOWN since Apr 25th, 2024 at 3120.74
Smart Scan Analysis for N35EURGI
Based on our trend formula, N35EURGI is rated as a -70 on a scale from -100 (Strong Downtrend) to +100 (Strong Uptrend).
| Open | High | Low | Price | Change |
|---|---|---|---|---|
| 3116.28 | 3134.47 | 3100.20 | 3125.12 | +0.16 |
| Prev. Close | Volume | Bid | Ask | Time |
| 3124.96 | 0 | 2024-04-25 06:26:00 |