Index Trend Analysis Report
Prepared for you on Friday, November 22, 2024.
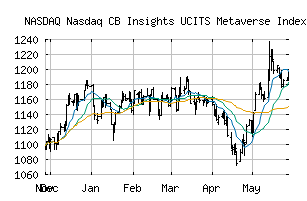
Nasdaq CB Insights UCITS Metaverse Index (NASDAQ:NCMETA)
Bull Market Weakness (+75) - NCMETA is showing signs of short-term weakness, but still remains in the confines of a long-term uptrend. Keep an eye on NCMETA as it may be in the beginning stages of a reversal.
Is it time to buy, sell, or avoid NCMETA?
MarketClub looks at technical strength and momentum to determine if the timing is right for NCMETA.
Learn more about the Trade Triangles and how we make technical analysis as easy as buy and sell.
|
|||||||||||||||
|
|||||||||||||||
MarketClub’s Trade Triangles for NCMETA
![]() The long-term trend has been UP since Sep 27th, 2024 at 1289.11
The long-term trend has been UP since Sep 27th, 2024 at 1289.11
![]() The intermediate-term trend has been UP since Nov 5th, 2024 at 1276.43
The intermediate-term trend has been UP since Nov 5th, 2024 at 1276.43
![]() The short-term trend has been UP since Nov 20th, 2024 at 1268.86
The short-term trend has been UP since Nov 20th, 2024 at 1268.86
Smart Scan Analysis for NCMETA
Based on our trend formula, NCMETA is rated as a +70 on a scale from -100 (Strong Downtrend) to +100 (Strong Uptrend).
| Open | High | Low | Price | Change |
|---|---|---|---|---|
| 1268.74 | 1268.89 | 1265.85 | 1266.57 | -4.90 |
| Prev. Close | Volume | Bid | Ask | Time |
| 1268.81 | 0 | 2024-11-22 05:28:00 |