Index Trend Analysis Report
Prepared for you on Sunday, March 15, 2026.
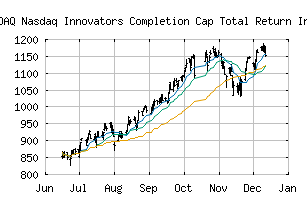
Nasdaq Innovators Completion Cap Total Return Index CHF (NASDAQ:NCXTCHF)
Weak Downtrend (-65) - NCXTCHF is showing signs of a strengthening downtrend. Monitor NCXTCHF as it may be building momentum to the downside.
Is it time to buy, sell, or avoid NCXTCHF?
MarketClub looks at technical strength and momentum to determine if the timing is right for NCXTCHF.
Learn more about the Trade Triangles and how we make technical analysis as easy as buy and sell.
|
|||||||||||||||
|
|||||||||||||||
MarketClub’s Trade Triangles for NCXTCHF
![]() The long-term trend has been UP since Jul 2nd, 2025 at 887.54
The long-term trend has been UP since Jul 2nd, 2025 at 887.54
![]() The intermediate-term trend has been DOWN since Mar 6th, 2026 at 1115.87
The intermediate-term trend has been DOWN since Mar 6th, 2026 at 1115.87
![]() The short-term trend has been DOWN since Mar 3rd, 2026 at 1148.58
The short-term trend has been DOWN since Mar 3rd, 2026 at 1148.58
Smart Scan Analysis for NCXTCHF
Based on our trend formula, NCXTCHF is rated as a -70 on a scale from -100 (Strong Downtrend) to +100 (Strong Uptrend).
| Open | High | Low | Price | Change |
|---|---|---|---|---|
| 1123.45 | 1135.68 | 1111.72 | 1118.37 | -31.55 |
| Prev. Close | Volume | Bid | Ask | Time |
| 1149.92 | 0 | 2026-03-06 17:14:00 |