Index Trend Analysis Report
Prepared for you on Friday, October 31, 2025.
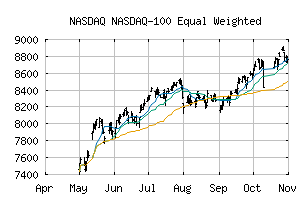
NASDAQ-100 Equal Weighted (NASDAQ:NDXE)
Countertrend Up (+85) - NDXE is showing short-term weakness. However, look for the longer-term bullish trend to resume. As always, continue to monitor the trend score and utilize a stop order.
Is it time to buy, sell, or avoid NDXE?
MarketClub looks at technical strength and momentum to determine if the timing is right for NDXE.
Learn more about the Trade Triangles and how we make technical analysis as easy as buy and sell.
|
|||||||||||||||
|
|||||||||||||||
MarketClub’s Trade Triangles for NDXE
![]() The long-term trend has been UP since Jun 4th, 2025 at 8069.76
The long-term trend has been UP since Jun 4th, 2025 at 8069.76
![]() The intermediate-term trend has been UP since Sep 15th, 2025 at 8385.86
The intermediate-term trend has been UP since Sep 15th, 2025 at 8385.86
![]() The short-term trend has been DOWN since Oct 29th, 2025 at 8793.83
The short-term trend has been DOWN since Oct 29th, 2025 at 8793.83
Smart Scan Analysis for NDXE
Based on our trend formula, NDXE is rated as a +85 on a scale from -100 (Strong Downtrend) to +100 (Strong Uptrend).
| Open | High | Low | Price | Change |
|---|---|---|---|---|
| 8732.37 | 8794.32 | 8721.46 | 8769.72 | +44.64 |
| Prev. Close | Volume | Bid | Ask | Time |
| 8725.08 | 0 | 2025-10-31 15:13:54 |
| 52wk High | 3895 | 52wk High Date | 2018-08-29 |
| 52wk Low | 3338.71 | 52wk Low Date | 2018-10-29 |