Index Trend Analysis Report
Prepared for you on Tuesday, March 3, 2026.
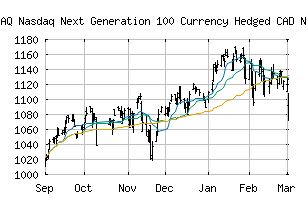
Nasdaq Next Generation 100 Currency Hedged CAD NTR Index (NASDAQ:NGXNCADMH)
Strong Downtrend (-100) - NGXNCADMH is in a strong downtrend that is likely to continue. With short-term, intermediate, and long-term bearish momentum, NGXNCADMH continues to fall. Traders should use caution and set stops.
Is it time to buy, sell, or avoid NGXNCADMH?
MarketClub looks at technical strength and momentum to determine if the timing is right for NGXNCADMH.
Learn more about the Trade Triangles and how we make technical analysis as easy as buy and sell.
|
|||||||||||||||
|
|||||||||||||||
MarketClub’s Trade Triangles for NGXNCADMH
![]() The long-term trend has been DOWN since Mar 3rd, 2026 at 1077.35
The long-term trend has been DOWN since Mar 3rd, 2026 at 1077.35
![]() The intermediate-term trend has been DOWN since Feb 3rd, 2026 at 1121.60
The intermediate-term trend has been DOWN since Feb 3rd, 2026 at 1121.60
![]() The short-term trend has been DOWN since Feb 23rd, 2026 at 1119.47
The short-term trend has been DOWN since Feb 23rd, 2026 at 1119.47
Smart Scan Analysis for NGXNCADMH
Based on our trend formula, NGXNCADMH is rated as a -100 on a scale from -100 (Strong Downtrend) to +100 (Strong Uptrend).
| Open | High | Low | Price | Change |
|---|---|---|---|---|
| 1091.46 | 1107.54 | 1072.63 | 1099.36 | -26.91 |
| Prev. Close | Volume | Bid | Ask | Time |
| 1126.27 | 0 | 2026-03-03 16:53:00 |