Index Trend Analysis Report
Prepared for you on Thursday, December 26, 2024.
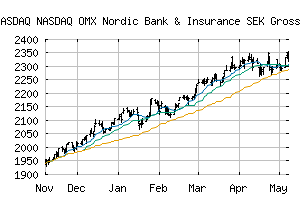
NASDAQ OMX Nordic Bank & Insurance SEK Gross Index (NASDAQ:NOMXNBISEKGI)
Countertrend Down (-85) - NOMXNBISEKGI is showing short-term strength. However, look for the longer-term bearish trend to resume. As always, continue to monitor the trend score and set stops.
Is it time to buy, sell, or avoid NOMXNBISEKGI?
MarketClub looks at technical strength and momentum to determine if the timing is right for NOMXNBISEKGI.
Learn more about the Trade Triangles and how we make technical analysis as easy as buy and sell.
|
|||||||||||||||
|
|||||||||||||||
MarketClub’s Trade Triangles for NOMXNBISEKGI
![]() The long-term trend has been DOWN since Dec 20th, 2024 at 2307.58
The long-term trend has been DOWN since Dec 20th, 2024 at 2307.58
![]() The intermediate-term trend has been DOWN since Dec 19th, 2024 at 2354.11
The intermediate-term trend has been DOWN since Dec 19th, 2024 at 2354.11
![]() The short-term trend has been UP since Dec 25th, 2024 at 2365.73
The short-term trend has been UP since Dec 25th, 2024 at 2365.73
Smart Scan Analysis for NOMXNBISEKGI
Based on our trend formula, NOMXNBISEKGI is rated as a -85 on a scale from -100 (Strong Downtrend) to +100 (Strong Uptrend).
| Open | High | Low | Price | Change |
|---|---|---|---|---|
| 2363.64 | 2364.22 | 2358.13 | 2361.17 | -4.16 |
| Prev. Close | Volume | Bid | Ask | Time |
| 2365.33 | 0 | 2024-12-26 11:30:00 |