Index Trend Analysis Report
Prepared for you on Thursday, September 25, 2025.
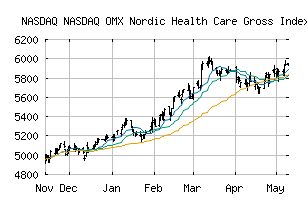
NASDAQ OMX Nordic Health Care Gross Index (NASDAQ:NOMXNHCGI)
Strong Downtrend (-100) - NOMXNHCGI is in a strong downtrend that is likely to continue. With short-term, intermediate, and long-term bearish momentum, NOMXNHCGI continues to fall. Traders should use caution and set stops.
Is it time to buy, sell, or avoid NOMXNHCGI?
MarketClub looks at technical strength and momentum to determine if the timing is right for NOMXNHCGI.
Learn more about the Trade Triangles and how we make technical analysis as easy as buy and sell.
|
|||||||||||||||
|
|||||||||||||||
MarketClub’s Trade Triangles for NOMXNHCGI
![]() The long-term trend has been DOWN since Oct 28th, 2024 at 5745.99
The long-term trend has been DOWN since Oct 28th, 2024 at 5745.99
![]() The intermediate-term trend has been DOWN since Sep 25th, 2025 at 4409.46
The intermediate-term trend has been DOWN since Sep 25th, 2025 at 4409.46
![]() The short-term trend has been DOWN since Sep 23rd, 2025 at 4450.57
The short-term trend has been DOWN since Sep 23rd, 2025 at 4450.57
Smart Scan Analysis for NOMXNHCGI
Based on our trend formula, NOMXNHCGI is rated as a -100 on a scale from -100 (Strong Downtrend) to +100 (Strong Uptrend).
| Open | High | Low | Price | Change |
|---|---|---|---|---|
| 4419.25 | 4419.25 | 4336.93 | 4336.93 | -103.66 |
| Prev. Close | Volume | Bid | Ask | Time |
| 4440.59 | 0 | 2025-09-25 11:30:00 |
| 52wk High | 2682.33 | 52wk High Date | 2018-07-27 |
| 52wk Low | 1962.6 | 52wk Low Date | 2018-02-06 |