Index Trend Analysis Report
Prepared for you on Thursday, December 26, 2024.
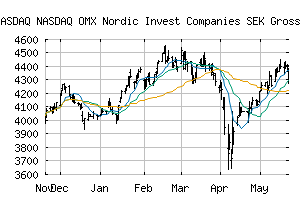
NASDAQ OMX Nordic Invest Companies SEK Gross Index (NASDAQ:NOMXNICSEKGI)
Strong Downtrend (-100) - NOMXNICSEKGI is in a strong downtrend that is likely to continue. With short-term, intermediate, and long-term bearish momentum, NOMXNICSEKGI continues to fall. Traders should use caution and set stops.
Is it time to buy, sell, or avoid NOMXNICSEKGI?
MarketClub looks at technical strength and momentum to determine if the timing is right for NOMXNICSEKGI.
Learn more about the Trade Triangles and how we make technical analysis as easy as buy and sell.
|
|||||||||||||||
|
|||||||||||||||
MarketClub’s Trade Triangles for NOMXNICSEKGI
![]() The long-term trend has been DOWN since Dec 20th, 2024 at 3955.18
The long-term trend has been DOWN since Dec 20th, 2024 at 3955.18
![]() The intermediate-term trend has been DOWN since Dec 19th, 2024 at 4054.92
The intermediate-term trend has been DOWN since Dec 19th, 2024 at 4054.92
![]() The short-term trend has been DOWN since Dec 9th, 2024 at 4207.07
The short-term trend has been DOWN since Dec 9th, 2024 at 4207.07
Smart Scan Analysis for NOMXNICSEKGI
Based on our trend formula, NOMXNICSEKGI is rated as a -100 on a scale from -100 (Strong Downtrend) to +100 (Strong Uptrend).
| Open | High | Low | Price | Change |
|---|---|---|---|---|
| 4029.89 | 4030.14 | 4026.91 | 4027.54 | -3.26 |
| Prev. Close | Volume | Bid | Ask | Time |
| 4030.80 | 0 | 2024-12-26 04:37:00 |