Index Trend Analysis Report
Prepared for you on Sunday, May 11, 2025.
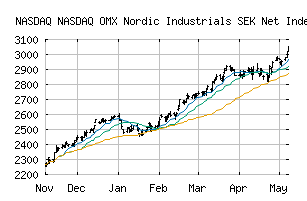
NASDAQ OMX Nordic Industrials SEK Net Index (NASDAQ:NOMXNINSEKNI)
Crossroads (+60) - NOMXNINSEKNI is struggling to move into a solid trend. Beware of choppy markets and consider a sidelines position until a stronger trend is identified.
Is it time to buy, sell, or avoid NOMXNINSEKNI?
MarketClub looks at technical strength and momentum to determine if the timing is right for NOMXNINSEKNI.
Learn more about the Trade Triangles and how we make technical analysis as easy as buy and sell.
|
|||||||||||||||
|
|||||||||||||||
MarketClub’s Trade Triangles for NOMXNINSEKNI
![]() The long-term trend has been DOWN since Apr 1st, 2025 at 2827.70
The long-term trend has been DOWN since Apr 1st, 2025 at 2827.70
![]() The intermediate-term trend has been UP since Apr 28th, 2025 at 2810.93
The intermediate-term trend has been UP since Apr 28th, 2025 at 2810.93
![]() The short-term trend has been UP since May 8th, 2025 at 2875.32
The short-term trend has been UP since May 8th, 2025 at 2875.32
Smart Scan Analysis for NOMXNINSEKNI
Based on our trend formula, NOMXNINSEKNI is rated as a +60 on a scale from -100 (Strong Downtrend) to +100 (Strong Uptrend).
| Open | High | Low | Price | Change |
|---|---|---|---|---|
| 2887.16 | 2899.89 | 2867.49 | 2875.94 | +3.17 |
| Prev. Close | Volume | Bid | Ask | Time |
| 2875.94 | 0 | 2025-05-09 11:33:00 |