Index Trend Analysis Report
Prepared for you on Thursday, March 5, 2026.
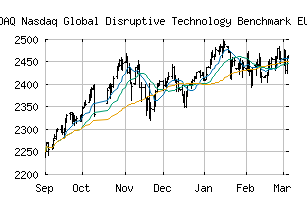
Nasdaq Global Disruptive Technology Benchmark EUR Index (NASDAQ:NYDTBEUR)
Countertrend Up (+85) - NYDTBEUR is showing short-term weakness. However, look for the longer-term bullish trend to resume. As always, continue to monitor the trend score and utilize a stop order.
Is it time to buy, sell, or avoid NYDTBEUR?
MarketClub looks at technical strength and momentum to determine if the timing is right for NYDTBEUR.
Learn more about the Trade Triangles and how we make technical analysis as easy as buy and sell.
|
|||||||||||||||
|
|||||||||||||||
MarketClub’s Trade Triangles for NYDTBEUR
![]() The long-term trend has been UP since Jul 3rd, 2025 at 2156.18
The long-term trend has been UP since Jul 3rd, 2025 at 2156.18
![]() The intermediate-term trend has been UP since Feb 25th, 2026 at 2473.74
The intermediate-term trend has been UP since Feb 25th, 2026 at 2473.74
![]() The short-term trend has been DOWN since Mar 2nd, 2026 at 2445.93
The short-term trend has been DOWN since Mar 2nd, 2026 at 2445.93
Smart Scan Analysis for NYDTBEUR
Based on our trend formula, NYDTBEUR is rated as a +85 on a scale from -100 (Strong Downtrend) to +100 (Strong Uptrend).
| Open | High | Low | Price | Change |
|---|---|---|---|---|
| 2459.15 | 2462.93 | 2458.84 | 2462.46 | +31.84 |
| Prev. Close | Volume | Bid | Ask | Time |
| 2459.34 | 0 | 2026-03-05 00:44:00 |