Mutual Trend Analysis Report
Prepared for you on Monday, March 30, 2026.
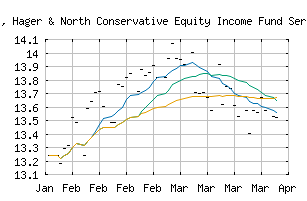
Phillips, Hager & North Conservative Equity Income Fund Series F NL (463794A2) (NASDAQ:OBILX)
Weak Downtrend (-65) - OBILX is showing signs of a strengthening downtrend. Monitor OBILX as it may be building momentum to the downside.
Is it time to buy, sell, or avoid OBILX?
MarketClub looks at technical strength and momentum to determine if the timing is right for OBILX.
Learn more about the Trade Triangles and how we make technical analysis as easy as buy and sell.
|
|||||||||||||||
|
|||||||||||||||
MarketClub’s Trade Triangles for OBILX
![]() The long-term trend has been UP since Feb 3rd, 2026 at 13.2427
The long-term trend has been UP since Feb 3rd, 2026 at 13.2427
![]() The intermediate-term trend has been DOWN since Mar 20th, 2026 at 13.5731
The intermediate-term trend has been DOWN since Mar 20th, 2026 at 13.5731
![]() The short-term trend has been DOWN since Mar 29th, 2026 at 13.5625
The short-term trend has been DOWN since Mar 29th, 2026 at 13.5625
Smart Scan Analysis for OBILX
Based on our trend formula, OBILX is rated as a -70 on a scale from -100 (Strong Downtrend) to +100 (Strong Uptrend).
| Open | High | Low | Price | Change |
|---|---|---|---|---|
| 13.5237 | 13.5237 | 13.5237 | 13.5237 | -0.0493 |
| Prev. Close | Volume | Bid | Ask | Time |
| 13.5237 | 0 | 2026-03-30 00:00:00 |