Index Trend Analysis Report
Prepared for you on Wednesday, January 28, 2026.
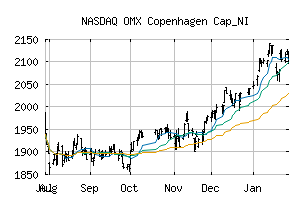
OMX Copenhagen Cap_NI (NASDAQ:OMXCCAPNI)
Countertrend Up (+85) - OMXCCAPNI is showing short-term weakness. However, look for the longer-term bullish trend to resume. As always, continue to monitor the trend score and utilize a stop order.
Is it time to buy, sell, or avoid OMXCCAPNI?
MarketClub looks at technical strength and momentum to determine if the timing is right for OMXCCAPNI.
Learn more about the Trade Triangles and how we make technical analysis as easy as buy and sell.
|
|||||||||||||||
|
|||||||||||||||
MarketClub’s Trade Triangles for OMXCCAPNI
![]() The long-term trend has been UP since Nov 11th, 2025 at 1960.53
The long-term trend has been UP since Nov 11th, 2025 at 1960.53
![]() The intermediate-term trend has been UP since Dec 2nd, 2025 at 1990.43
The intermediate-term trend has been UP since Dec 2nd, 2025 at 1990.43
![]() The short-term trend has been DOWN since Jan 28th, 2026 at 2097.80
The short-term trend has been DOWN since Jan 28th, 2026 at 2097.80
Smart Scan Analysis for OMXCCAPNI
Based on our trend formula, OMXCCAPNI is rated as a +85 on a scale from -100 (Strong Downtrend) to +100 (Strong Uptrend).
| Open | High | Low | Price | Change |
|---|---|---|---|---|
| 2124.05 | 2124.41 | 2097.34 | 2103.24 | -20.99 |
| Prev. Close | Volume | Bid | Ask | Time |
| 2124.23 | 0 | 2026-01-28 11:04:00 |