Index Trend Analysis Report
Prepared for you on Sunday, September 14, 2025.
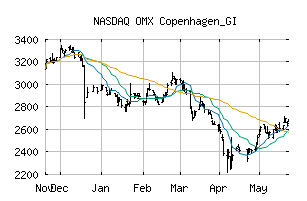
OMX Copenhagen_GI (NASDAQ:OMXCGI)
Countertrend Down (-85) - OMXCGI is showing short-term strength. However, look for the longer-term bearish trend to resume. As always, continue to monitor the trend score and set stops.
Is it time to buy, sell, or avoid OMXCGI?
MarketClub looks at technical strength and momentum to determine if the timing is right for OMXCGI.
Learn more about the Trade Triangles and how we make technical analysis as easy as buy and sell.
|
|||||||||||||||
|
|||||||||||||||
MarketClub’s Trade Triangles for OMXCGI
![]() The long-term trend has been DOWN since Aug 5th, 2024 at 3349.03
The long-term trend has been DOWN since Aug 5th, 2024 at 3349.03
![]() The intermediate-term trend has been DOWN since Jul 29th, 2025 at 2563.76
The intermediate-term trend has been DOWN since Jul 29th, 2025 at 2563.76
![]() The short-term trend has been UP since Sep 12th, 2025 at 2419.69
The short-term trend has been UP since Sep 12th, 2025 at 2419.69
Smart Scan Analysis for OMXCGI
Based on our trend formula, OMXCGI is rated as a -85 on a scale from -100 (Strong Downtrend) to +100 (Strong Uptrend).
| Open | High | Low | Price | Change |
|---|---|---|---|---|
| 2405.33 | 2426.58 | 2405.33 | 2412.16 | +12.59 |
| Prev. Close | Volume | Bid | Ask | Time |
| 2412.16 | 0 | 2025-09-12 11:04:00 |
| 52wk High | 1451.44 | 52wk High Date | 2018-07-27 |
| 52wk Low | 1230.78 | 52wk Low Date | 2018-10-11 |