Index Trend Analysis Report
Prepared for you on Tuesday, March 17, 2026.
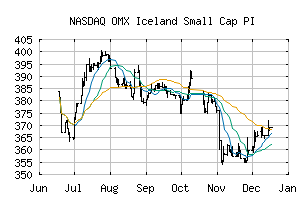
OMX Iceland Small Cap PI (NASDAQ:OMXISCPI)
Weak Uptrend (+65) - OMXISCPI is showing signs of weakening momentum to the upside. Monitor OMXISCPI as it may be in the beginning stages of a reversal.
Is it time to buy, sell, or avoid OMXISCPI?
MarketClub looks at technical strength and momentum to determine if the timing is right for OMXISCPI.
Learn more about the Trade Triangles and how we make technical analysis as easy as buy and sell.
|
|||||||||||||||
|
|||||||||||||||
MarketClub’s Trade Triangles for OMXISCPI
![]() The long-term trend has been UP since Feb 3rd, 2026 at 382.89
The long-term trend has been UP since Feb 3rd, 2026 at 382.89
![]() The intermediate-term trend has been DOWN since Feb 18th, 2026 at 368.36
The intermediate-term trend has been DOWN since Feb 18th, 2026 at 368.36
![]() The short-term trend has been UP since Mar 5th, 2026 at 379.40
The short-term trend has been UP since Mar 5th, 2026 at 379.40
Smart Scan Analysis for OMXISCPI
Based on our trend formula, OMXISCPI is rated as a +65 on a scale from -100 (Strong Downtrend) to +100 (Strong Uptrend).
| Open | High | Low | Price | Change |
|---|---|---|---|---|
| 378.91 | 378.91 | 375.65 | 376.41 | -2.50 |
| Prev. Close | Volume | Bid | Ask | Time |
| 378.91 | 0 | 2026-03-06 11:34:00 |
| 52wk High | 273.98 | 52wk High Date | 2018-01-26 |
| 52wk Low | 214.36 | 52wk Low Date | 2018-11-29 |