Index Trend Analysis Report
Prepared for you on Thursday, February 19, 2026.
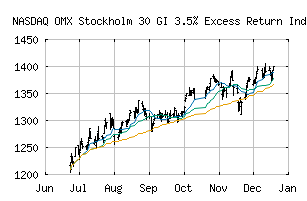
OMX Stockholm 30 GI 3.5% Excess Return Index (NASDAQ:OMXS30ER)
Strong Uptrend (+100) - OMXS30ER is in a strong uptrend that is likely to continue. With short-term, intermediate, and long-term bullish momentum, OMXS30ER continues to climb. Traders should protect gains and look for a change in score to suggest a slow down in momentum.
Is it time to buy, sell, or avoid OMXS30ER?
MarketClub looks at technical strength and momentum to determine if the timing is right for OMXS30ER.
Learn more about the Trade Triangles and how we make technical analysis as easy as buy and sell.
|
|||||||||||||||
|
|||||||||||||||
MarketClub’s Trade Triangles for OMXS30ER
![]() The long-term trend has been UP since Jul 10th, 2025 at 1285.16
The long-term trend has been UP since Jul 10th, 2025 at 1285.16
![]() The intermediate-term trend has been UP since Dec 5th, 2025 at 1392.12
The intermediate-term trend has been UP since Dec 5th, 2025 at 1392.12
![]() The short-term trend has been UP since Feb 18th, 2026 at 1535.91
The short-term trend has been UP since Feb 18th, 2026 at 1535.91
Smart Scan Analysis for OMXS30ER
Based on our trend formula, OMXS30ER is rated as a +100 on a scale from -100 (Strong Downtrend) to +100 (Strong Uptrend).
| Open | High | Low | Price | Change |
|---|---|---|---|---|
| 1549.20 | 1549.90 | 1542.42 | 1546.88 | -3.44 |
| Prev. Close | Volume | Bid | Ask | Time |
| 1550.32 | 0 | 2026-02-19 11:34:00 |