Index Trend Analysis Report
Prepared for you on Tuesday, July 1, 2025.
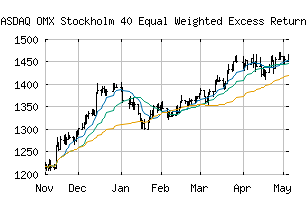
OMX Stockholm 40 Equal Weighted Excess Return Inde (NASDAQ:OMXS40ER)
Weak Downtrend (-65) - OMXS40ER is showing signs of a strengthening downtrend. Monitor OMXS40ER as it may be building momentum to the downside.
Is it time to buy, sell, or avoid OMXS40ER?
MarketClub looks at technical strength and momentum to determine if the timing is right for OMXS40ER.
Learn more about the Trade Triangles and how we make technical analysis as easy as buy and sell.
|
|||||||||||||||
|
|||||||||||||||
MarketClub’s Trade Triangles for OMXS40ER
![]() The long-term trend has been DOWN since Apr 2nd, 2025 at 1377.86
The long-term trend has been DOWN since Apr 2nd, 2025 at 1377.86
![]() The intermediate-term trend has been DOWN since Jun 23rd, 2025 at 1392.55
The intermediate-term trend has been DOWN since Jun 23rd, 2025 at 1392.55
![]() The short-term trend has been UP since Jun 24th, 2025 at 1415.22
The short-term trend has been UP since Jun 24th, 2025 at 1415.22
Smart Scan Analysis for OMXS40ER
Based on our trend formula, OMXS40ER is rated as a -65 on a scale from -100 (Strong Downtrend) to +100 (Strong Uptrend).
| Open | High | Low | Price | Change |
|---|---|---|---|---|
| 1430.06 | 1434.51 | 1424.06 | 1426.00 | -4.26 |
| Prev. Close | Volume | Bid | Ask | Time |
| 1430.26 | 0 | 2025-07-01 06:16:00 |