Index Trend Analysis Report
Prepared for you on Saturday, December 13, 2025.
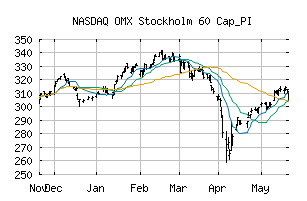
OMX Stockholm 60 Cap_PI (NASDAQ:OMXS60CAPPI)
Long-Term Uptrend (+90) - OMXS60CAPPI is in a strong uptrend that is likely to continue. While OMXS60CAPPI is showing intraday weakness, it remains in the confines of a bullish trend. Traders should use caution and utilize a stop order.
Is it time to buy, sell, or avoid OMXS60CAPPI?
MarketClub looks at technical strength and momentum to determine if the timing is right for OMXS60CAPPI.
Learn more about the Trade Triangles and how we make technical analysis as easy as buy and sell.
|
|||||||||||||||
|
|||||||||||||||
MarketClub’s Trade Triangles for OMXS60CAPPI
![]() The long-term trend has been UP since Jul 10th, 2025 at 315.34
The long-term trend has been UP since Jul 10th, 2025 at 315.34
![]() The intermediate-term trend has been UP since Dec 5th, 2025 at 341.07
The intermediate-term trend has been UP since Dec 5th, 2025 at 341.07
![]() The short-term trend has been UP since Dec 12th, 2025 at 341.53
The short-term trend has been UP since Dec 12th, 2025 at 341.53
Smart Scan Analysis for OMXS60CAPPI
Based on our trend formula, OMXS60CAPPI is rated as a +90 on a scale from -100 (Strong Downtrend) to +100 (Strong Uptrend).
| Open | High | Low | Price | Change |
|---|---|---|---|---|
| 341.47 | 343.41 | 339.66 | 339.88 | -0.73 |
| Prev. Close | Volume | Bid | Ask | Time |
| 339.88 | 0 | 2025-12-12 11:34:00 |
| 52wk High | 206.09 | 52wk High Date | 2018-08-29 |
| 52wk Low | 176.44 | 52wk Low Date | 2018-11-20 |