Stock Trend Analysis Report
Prepared for you on Friday, June 27, 2025.
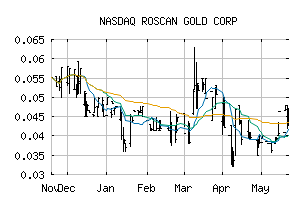
ROSCAN GOLD CORP (NASDAQ:RCGCF)
Weak Downtrend (-65) - RCGCF is showing signs of a strengthening downtrend. Monitor RCGCF as it may be building momentum to the downside.
Is it time to buy, sell, or avoid RCGCF?
MarketClub looks at technical strength and momentum to determine if the timing is right for RCGCF.
Learn more about the Trade Triangles and how we make technical analysis as easy as buy and sell.
|
|||||||||||||||
|
|||||||||||||||
MarketClub’s Trade Triangles for RCGCF
![]() The long-term trend has been DOWN since Apr 8th, 2025 at 0.03600
The long-term trend has been DOWN since Apr 8th, 2025 at 0.03600
![]() The intermediate-term trend has been UP since May 15th, 2025 at 0.04390
The intermediate-term trend has been UP since May 15th, 2025 at 0.04390
![]() The short-term trend has been DOWN since Jun 26th, 2025 at 0.05195
The short-term trend has been DOWN since Jun 26th, 2025 at 0.05195
Smart Scan Analysis for RCGCF
Based on our trend formula, RCGCF is rated as a -65 on a scale from -100 (Strong Downtrend) to +100 (Strong Uptrend).
| Open | High | Low | Price | Change |
|---|---|---|---|---|
| 0.0560 | 0.0560 | 0.0501 | 0.0501 | +0.0002 |
| Prev. Close | Volume | Bid | Ask | Time |
| 0.0499 | 1111 | 2025-06-27 09:44:00 |