Index Trend Analysis Report
Prepared for you on Friday, December 19, 2025.
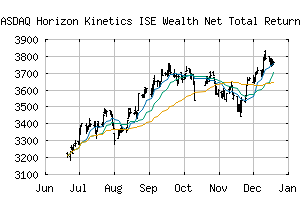
Horizon Kinetics ISE Wealth Net Total Return Index (NASDAQ:RCHNTR)
Countertrend Up (+85) - RCHNTR is showing short-term weakness. However, look for the longer-term bullish trend to resume. As always, continue to monitor the trend score and utilize a stop order.
Is it time to buy, sell, or avoid RCHNTR?
MarketClub looks at technical strength and momentum to determine if the timing is right for RCHNTR.
Learn more about the Trade Triangles and how we make technical analysis as easy as buy and sell.
|
|||||||||||||||
|
|||||||||||||||
MarketClub’s Trade Triangles for RCHNTR
![]() The long-term trend has been UP since Jun 27th, 2025 at 3289.30
The long-term trend has been UP since Jun 27th, 2025 at 3289.30
![]() The intermediate-term trend has been UP since Nov 26th, 2025 at 3645.69
The intermediate-term trend has been UP since Nov 26th, 2025 at 3645.69
![]() The short-term trend has been DOWN since Dec 16th, 2025 at 3769.80
The short-term trend has been DOWN since Dec 16th, 2025 at 3769.80
Smart Scan Analysis for RCHNTR
Based on our trend formula, RCHNTR is rated as a +85 on a scale from -100 (Strong Downtrend) to +100 (Strong Uptrend).
| Open | High | Low | Price | Change |
|---|---|---|---|---|
| 3750.40 | 3766.75 | 3749.48 | 3762.28 | +8.70 |
| Prev. Close | Volume | Bid | Ask | Time |
| 3753.58 | 0 | 2025-12-19 16:04:00 |