Stock Trend Analysis Report
Prepared for you on Tuesday, October 22, 2024.
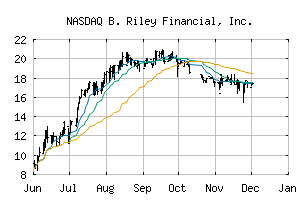
B. Riley Financial, Inc. (NASDAQ:RILYG)
Weak Downtrend (-65) - RILYG is showing signs of a strengthening downtrend. Monitor RILYG as it may be building momentum to the downside.
Is it time to buy, sell, or avoid RILYG?
MarketClub looks at technical strength and momentum to determine if the timing is right for RILYG.
Learn more about the Trade Triangles and how we make technical analysis as easy as buy and sell.
|
|||||||||||||||
|
|||||||||||||||
MarketClub’s Trade Triangles for RILYG
![]() The long-term trend has been DOWN since Aug 12th, 2024 at 17.0001
The long-term trend has been DOWN since Aug 12th, 2024 at 17.0001
![]() The intermediate-term trend has been DOWN since Sep 30th, 2024 at 11.6200
The intermediate-term trend has been DOWN since Sep 30th, 2024 at 11.6200
![]() The short-term trend has been UP since Oct 14th, 2024 at 9.7300
The short-term trend has been UP since Oct 14th, 2024 at 9.7300
Smart Scan Analysis for RILYG
Based on our trend formula, RILYG is rated as a -65 on a scale from -100 (Strong Downtrend) to +100 (Strong Uptrend).
-65
Strong Downtrend
Sideways
Strong Uptrend
| Open | High | Low | Price | Change |
|---|---|---|---|---|
| 11.6000 | 11.5283 | 11.3000 | 11.4499 | -0.2401 |
| Prev. Close | Volume | Bid | Ask | Time |
| 11.6900 | 12175 | 2024-10-22 15:09:00 |
| Year High | 25.63 | Year High Date | 2018-01-02 |
| Year Low | 24.11 | Year Low Date | 2018-11-20 |
| 52wk High | 20.75 | 52wk High Date | 2023-11-03 |
| 52wk Low | 6.87 | 52wk Low Date | 2024-08-15 |
| Average Volume | 41,551 | Assets | 499,764,400M |
| Liabilities | 476,919,500M | Volatility | 6.13 |
Get a free daily analysis and signals for B. Riley Financial, Inc. (RILYG) - Request Your Free Report.