Stock Trend Analysis Report
Prepared for you on Wednesday, April 24, 2024.
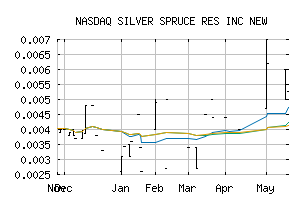
SILVER SPRUCE RES INC NEW (NASDAQ:SSEBF)
Countertrend Up (+85) - SSEBF is showing short-term weakness. However, look for the longer-term bullish trend to resume. As always, continue to monitor the trend score and utilize a stop order.
Is it time to buy, sell, or avoid SSEBF?
MarketClub looks at technical strength and momentum to determine if the timing is right for SSEBF.
Learn more about the Trade Triangles and how we make technical analysis as easy as buy and sell.
|
|||||||||||||||
|
|||||||||||||||
MarketClub’s Trade Triangles for SSEBF
![]() The long-term trend has been UP since Dec 1st, 2023 at 0.01090
The long-term trend has been UP since Dec 1st, 2023 at 0.01090
![]() The intermediate-term trend has been UP since Feb 16th, 2024 at 0.01050
The intermediate-term trend has been UP since Feb 16th, 2024 at 0.01050
![]() The short-term trend has been UP since Mar 11th, 2024 at 0.01055
The short-term trend has been UP since Mar 11th, 2024 at 0.01055
Smart Scan Analysis for SSEBF
Based on our trend formula, SSEBF is rated as a +80 on a scale from -100 (Strong Downtrend) to +100 (Strong Uptrend).
| Open | High | Low | Price | Change |
|---|---|---|---|---|
| 0.01530 | 0.01530 | 0.01340 | 0.01411 | +0.00011 |
| Prev. Close | Volume | Bid | Ask | Time |
| 0.01366 | 64000 | 2024-04-15 11:18:00 |
| Year High | 0.055 | Year High Date | 2018-01-09 |
| Year Low | 0.01 | Year Low Date | 2018-11-29 |
| 52wk High | 0.0269 | 52wk High Date | 2023-04-26 |
| 52wk Low | 0.0052 | 52wk Low Date | 2023-11-14 |
| Average Volume | 179,586 | Shares Outstanding | 11,196 |
| Assets | 1,421,739M | Liabilities | 111,753M |
| Volatility | 386.44 |