Index Trend Analysis Report
Prepared for you on Tuesday, January 21, 2025.
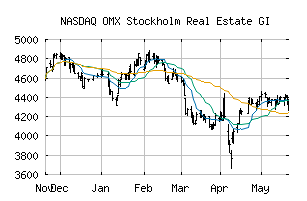
OMX Stockholm Real Estate GI (NASDAQ:SX35GI)
Weak Downtrend (-65) - SX35GI is showing signs of a strengthening downtrend. Monitor SX35GI as it may be building momentum to the downside.
Is it time to buy, sell, or avoid SX35GI?
MarketClub looks at technical strength and momentum to determine if the timing is right for SX35GI.
Learn more about the Trade Triangles and how we make technical analysis as easy as buy and sell.
|
|||||||||||||||
|
|||||||||||||||
MarketClub’s Trade Triangles for SX35GI
![]() The long-term trend has been DOWN since Nov 6th, 2024 at 4816.43
The long-term trend has been DOWN since Nov 6th, 2024 at 4816.43
![]() The intermediate-term trend has been DOWN since Oct 17th, 2024 at 5248.02
The intermediate-term trend has been DOWN since Oct 17th, 2024 at 5248.02
![]() The short-term trend has been UP since Jan 15th, 2025 at 4462.72
The short-term trend has been UP since Jan 15th, 2025 at 4462.72
Smart Scan Analysis for SX35GI
Based on our trend formula, SX35GI is rated as a -65 on a scale from -100 (Strong Downtrend) to +100 (Strong Uptrend).
| Open | High | Low | Price | Change |
|---|---|---|---|---|
| 4638.84 | 4638.84 | 4580.36 | 4599.54 | -39.41 |
| Prev. Close | Volume | Bid | Ask | Time |
| 4599.54 | 0 | 2025-01-20 11:33:00 |